Everyone had a slice.
Quality shared capacity with feature roadmaps. Cross-surface improvements depended on several teams finding time together.
Building the team, the process, and the measurement behind a better everyday experience. Connecting product quality to customer and business outcomes.
I led the Consumer UX Quality workstream: shaping the roadmap, owning the backlog, guiding design, and bringing Product, Engineering, and Analytics around a shared standard.
Quality work competed with feature delivery across separate teams. A larger allocation still left fragmented ownership and repeated handoffs. In March 2026, we brought the work into a dedicated Consumer Quality squad.
Quality shared capacity with feature roadmaps. Cross-surface improvements depended on several teams finding time together.
UI and backend engineers worked with design, product, and analytics support. One backlog and protected capacity made the work deliverable.
Shared standards. Clear ownership. Capacity to follow through.
We gave the team a shared definition: a product should solve the need, work consistently, feel easy, and be a pleasure to use. Each improvement maps back to these pillars.
Solves a real need with the right capabilities and information.
Can I do what I came to do?Works consistently, responds clearly, and keeps its promises.
Can I depend on it?Makes familiar tasks easy, intuitive, and accessible.
How much effort does it take?Feels considered, remembers context, and anticipates needs.
Does it feel good to use?We measured quality while improving what was already clearly broken. Both tracks fed the same backlog and the next delivery decision.
Combine journey data, research, support signals, and design reviews.
Output: a concrete user problem
Connect the issue to a quality pillar. Weigh customer impact, visibility, and effort.
Output: a ranked quality backlog
Design and engineer the change together. Fix the underlying pattern where needed.
Output: a reviewed improvement
Check interaction quality, business outcomes, and downstream guardrails.
Output: release, refine, or investigate
Behaviour shows where people struggle. Research helps explain why. Perception tells us whether an improvement feels better. Together, these give the quality discussion a firmer basis.
Loading times, app stability, and technical failures.
Time on task and taps across core ordering steps, alongside task success in research.
Perceived ease, trust, satisfaction, and joy of use.
Read the signals together. Segment by customer cohort, platform, and restaurant versus store orders. Check tracking quality. More browsing can mean exploration; fewer taps alone do not establish a better experience. Functionality remains connected to product measures such as adoption and conversion.
Quality debt appears in ordinary moments. The squad turned those moments into specific improvements across Menu, Basket, and Checkout.
Retain dish options so a repeat order does not mean rebuilding the same customisation.
Update changes in place and provide immediate feedback instead of blocking the whole flow.
Show mandatory paid options upfront and bring payment choices directly into the basket.
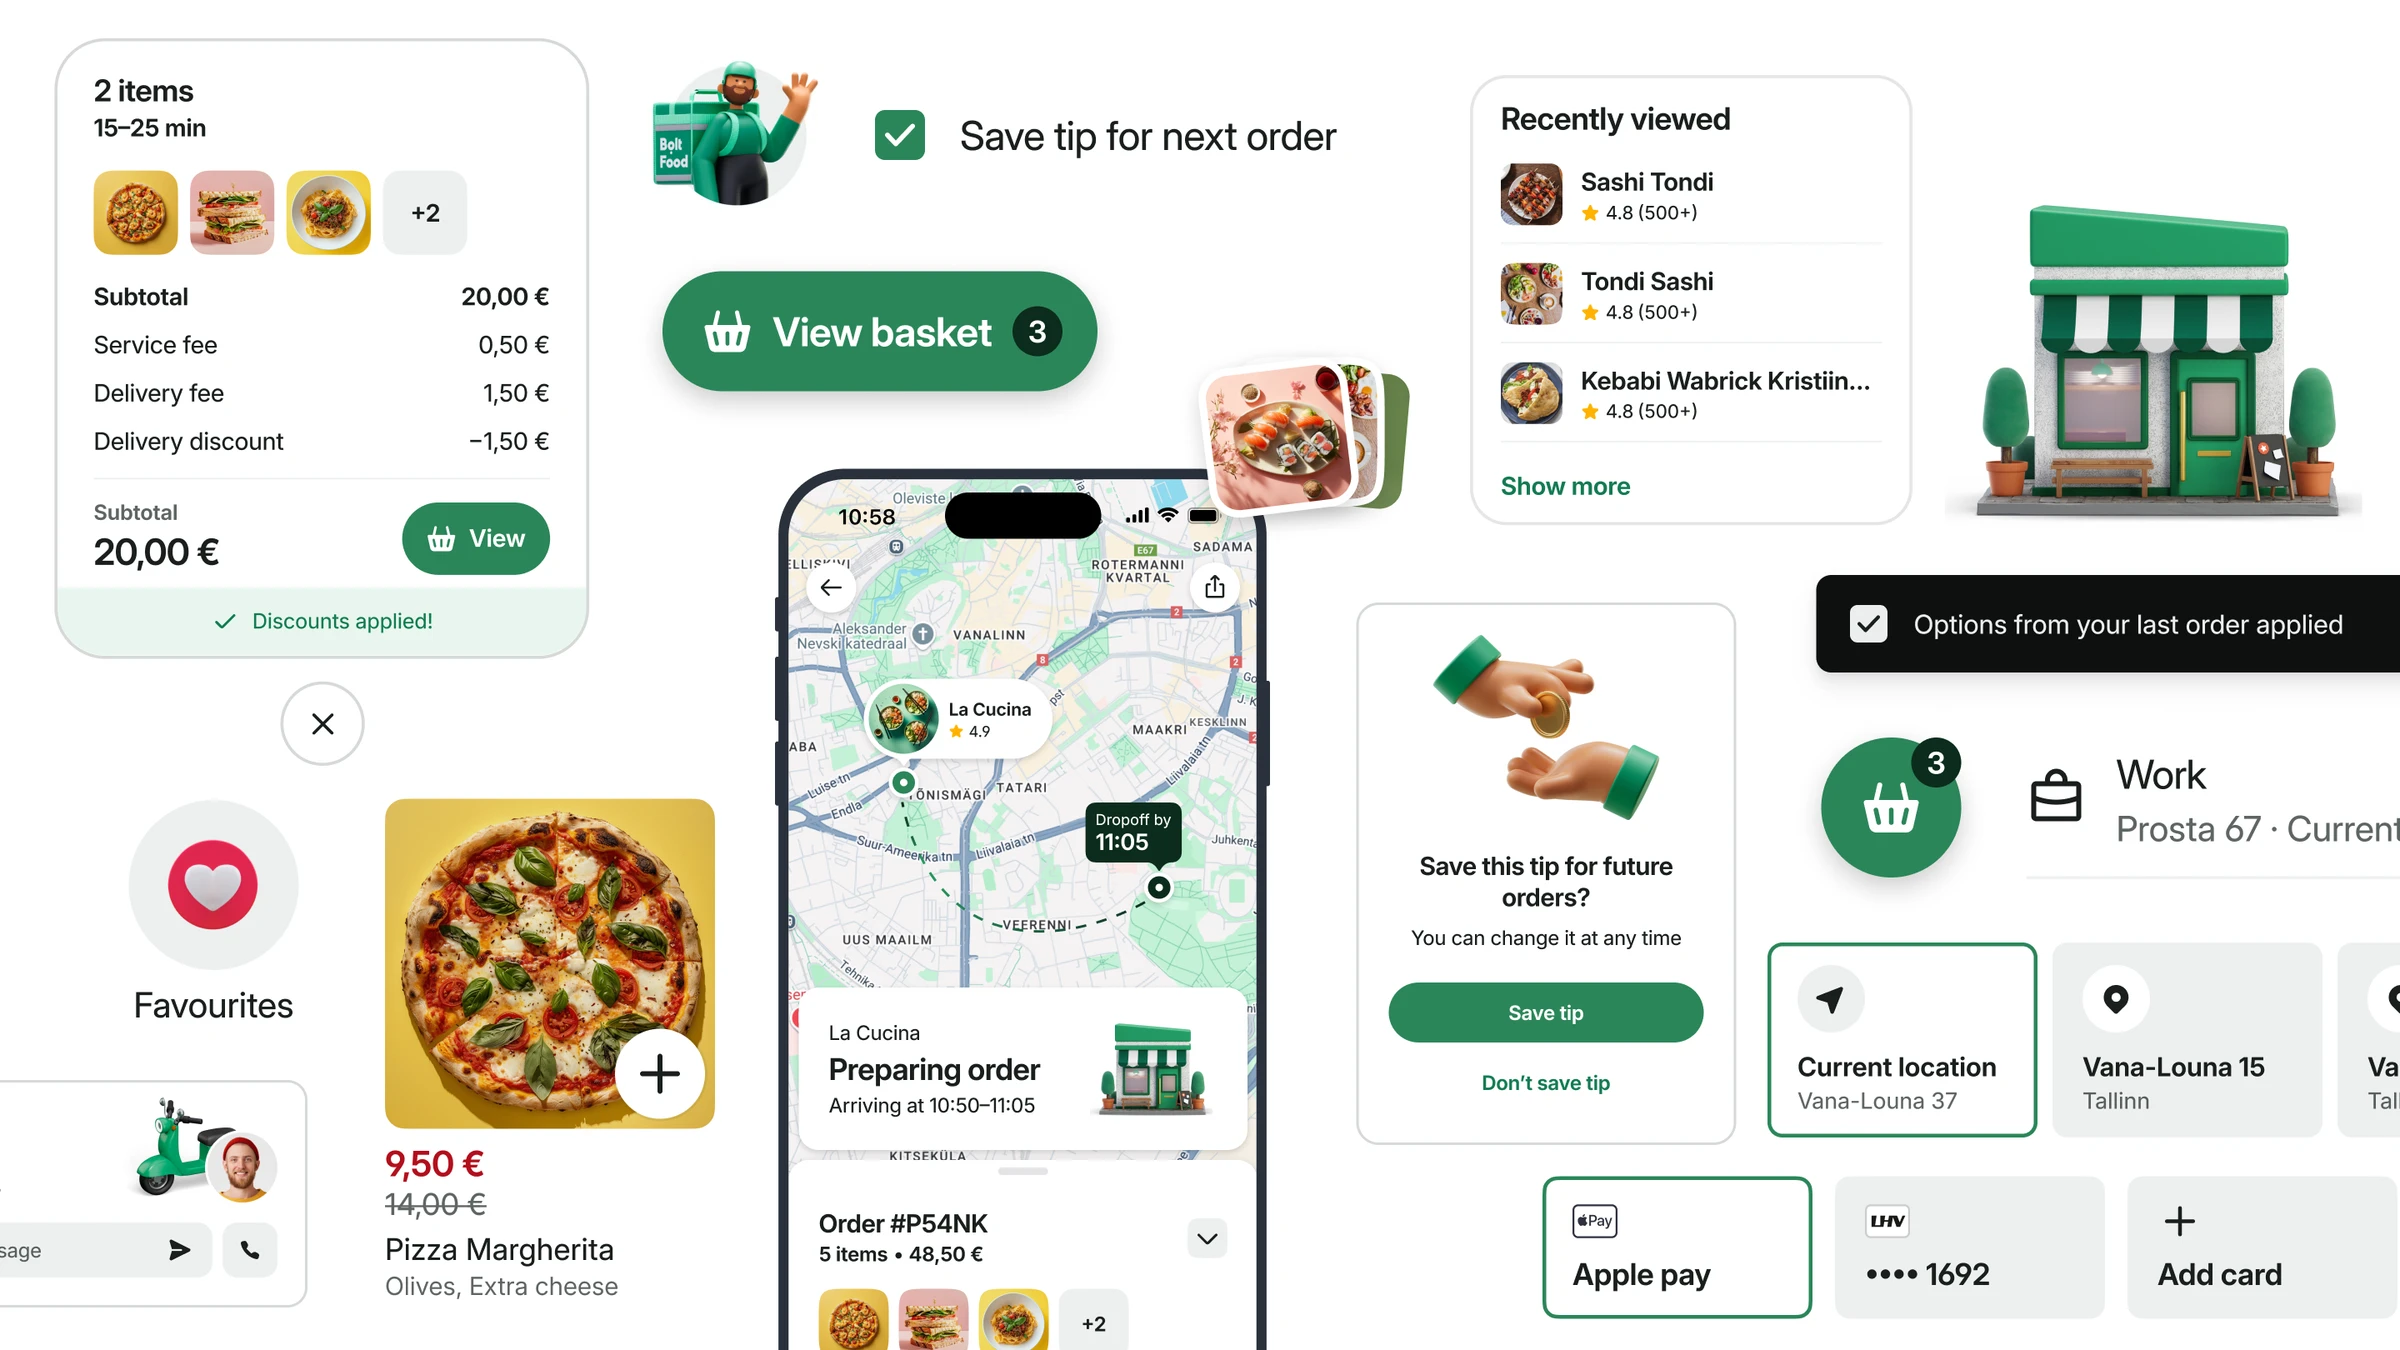
Controlled feature experiments connected simpler interactions to commercial and operational outcomes. The work improved more than the appearance of the product.
Easier decisions helped more people complete checkout and reduced avoidable support demand. Quality improvements created measurable business value.
Direct payment selection helped more users progress from their basket to a successful checkout.
Commercial impact: positive incremental GMV estimate.Payment-related contacts fell. A separate address-switch test also recorded fewer address-related contacts.
Operational impact: less avoidable support workload.Average basket taps fell in the payment-switch test while checkout time stayed stable.
Customer impact: a simpler path through a frequent decision.The payment-switch experiment met its success criteria and supported full rollout. Conversion, interaction effort, and support evidence gave the decision substance.
In the address-switch test, support contacts fell while average taps rose. We looked into the detail. Reducing taps was one signal, not the whole goal.
Results are shown directionally. They come from specific feature experiments, with different measures and populations. Broader journey trends remained mixed, so we continued refining the measurement and investigating where effort moved.
My contribution connected ownership, protected focus, a shared standard, and a feedback loop. The next step was to strengthen perception measurement so we could connect what improved in the data with what people actually felt.